CAT 2022 Slot 2 – LRDI Practice Questions
Set 1:
The following information is also known.
- There were equal numbers of domestic and foreign products.
- Half of the domestic products were FDA approved cosmetic products.
- None of the foreign products had both the approvals, while 60 domestic products had both the approvals.
- There were 140 nutrition products, half of them were foreign products.
- There were 200 FDA approved products. 70 of them were foreign products and 120 of them were cosmetic products.
🎥 Video Solution
🎥 Video Solution
Set 2:
Some details about the performances of three salesmen – Tohri, Hokli and Lahur, on two particular days are given below.
- Over the two days, all three of them met the same total number of households, and each of them sold a total of 100 items.
- On both days, Lahur met the same number of households and sold the same number of items.
- Hokli could not sell any item on the second day because the first household he met on that day complained against him.
- Tohri met 30 more households on the second day than on the first day.
- Tohri’s success rate was twice that of Lahur’s on the first day, and it was 75% of Lahur’s on the second day.
🎥 Video Solution
🎥 Video Solution
🎥 Video Solution
Set 3:
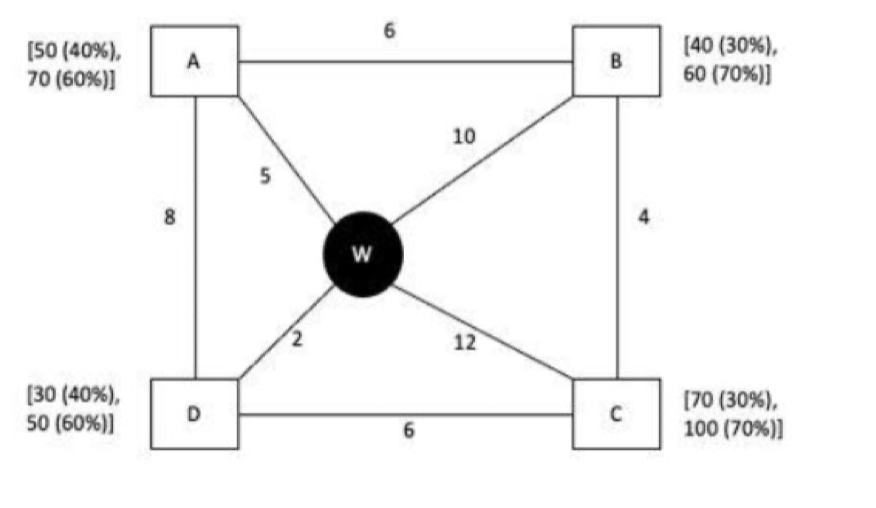
Every day the supplier gets the information about the demand values of the four locations and creates the travel route that starts from the warehouse and ends at a location after visiting all the locations exactly once. While making the route plan, the supplier goes to the locations in decreasing order of demand. If there is a tie for the choice of the next location, the supplier will go to the location closest to the current location. Also, while creating the route, the supplier can either follow the direct path (if available) from one location to another or can take the path via the warehouse. If both paths are available (direct and via warehouse), the supplier will choose the path with minimum distance.
🎥 Video Solution
🎥 Video Solution
Set 4:
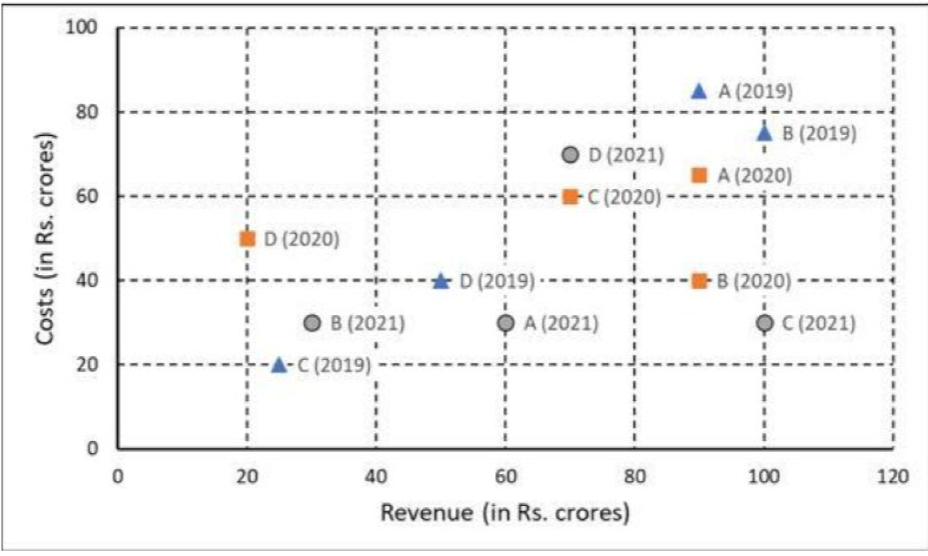
The first plot shows the revenues and costs incurred by the companies during these years. For example, in 2021, company C earned Rs.100 crores in revenue and spent Rs.30 crores. The profit of a company is defined as its revenue minus its costs.
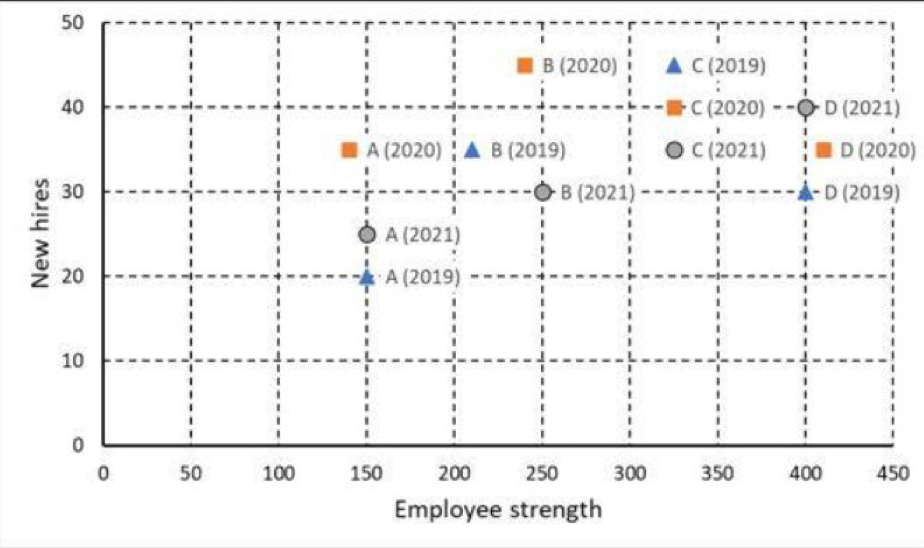
The second plot shows the number of employees employed by the company (employee strength) at the start of each of these three years, as well as the number of new employees hired each year (new hires). For example, Company B had 250 employees at the start of 2021, and 30 new employees joined the company during the year.