
CAT 2022 Slot 3 – LRDI Practice Questions
SET 1
The following are some additional facts about the number of students who took these two courses this year and the grades they obtained.
- The numbers of non-CS students who took AI and ML were in the ratio 2 : 5.
- The number of non-CS students who took either AI or ML was equal to the number of CS students.
- The numbers of non-CS students who failed in the two courses were the same and their total is equal to the number of CS students who got a C grade in ML.
- In both the courses, 50% of the students who passed got a B grade. But, while the numbers of students who got A and C grades were the same for AI, they were in the ratio 3 : 2 for ML.
- No CS student failed in AI, while no non-CS student got an A grade in AI.
- The numbers of CS students who got A, B and C grades respectively in AI were in the ratio 3 : 5 : 2, while in ML the ratio was 4 : 5 : 2.
- The ratio of the total number of non-CS students failing in one of the two courses to the number of CS students failing in one of the two courses was 3 : 1.
- 30 students failed in ML
🎥 Video Solution
🎥 Video Solution
Set 2:
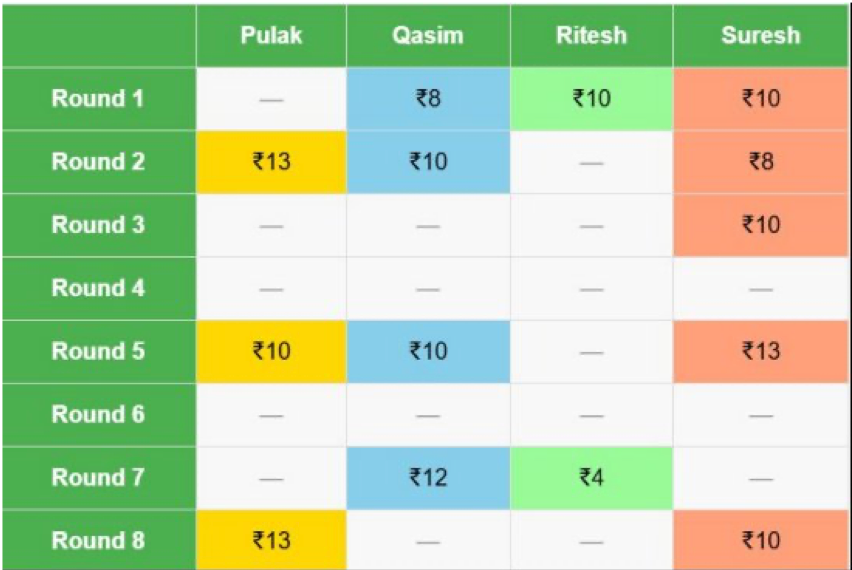
At the beginning of the tournament, the players had ₹10 each. The following table shows partial information about the amounts that the players had at the end of each of the eight rounds. It shows every time a player had ₹10 at the end of a round, as well as every time, at the end of a round, a player had either the minimum or the maximum amount that he would have had across the eight rounds. For example, Suresh had ₹10 at the end of Rounds 1, 3, and 8 and not after any of the other rounds. The maximum amount that he had at the end of any round was ₹13 (at the end of Round 5), and the minimum amount he had at the end of any round was ₹8 (at the end of Round 2). At the end of all other rounds, he must have had either ₹9, ₹11, or ₹12. It was also known that Pulak and Qasim had the same amount of money with them at the end of Round 4.
🎥 Video Solution
🎥 Video Solution
Set 3:
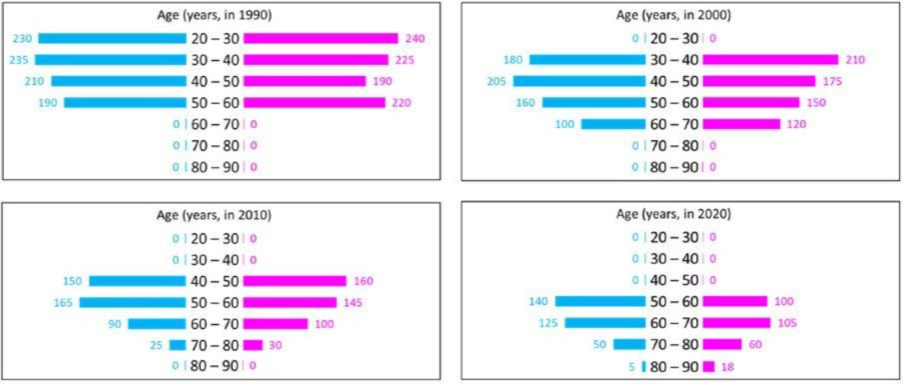
The four figures below depict the age profile of those among the 2000 individuals who were still alive in 1990, 2000, 2010, and 2020. The blue bars in each figure represent the number of males in each age group at that point in time, while the pink bars represent the number of females in each age group at that point in time. The numbers next to the bars give the exact numbers being represented by the bars. For example, we know that 230 males among those tracked and who were alive in 1990 were aged between 20 and 30.
🎥 Video Solution
🎥 Video Solution
Set 4:
There are only four neighbourhoods in a city – Levmisto, Tyhrmisto, Pesmisto and Kitmisto. During the onset of a pandemic, the number of new cases of a disease in each of these neighbourhoods was recorded over a period of five days. On each day, the number of new cases recorded in any of the neighbourhoods was either 0, 1, 2 or 3.
The following facts are also known:
- There was at least one new case in every neighbourhood on Day 1.
- On each of the five days, there were more new cases in Kitmisto than in Pesmisto.
- The number of new cases in the city in a day kept increasing during the five-day period. The number of new cases on Day 3 was exactly one more than that on Day 2.
- The maximum number of new cases in a day in Pesmisto was 2, and this happened only once during the five-day period.
- Kitmisto is the only place to have 3 new cases on Day 2.
- The total numbers of new cases in Levmisto, Tyhrmisto, Pesmisto and Kitmisto over the five-day period were 12, 12, 5 and 14 respectively.